
How Energy is Rewriting the Critical Minerals Outlook
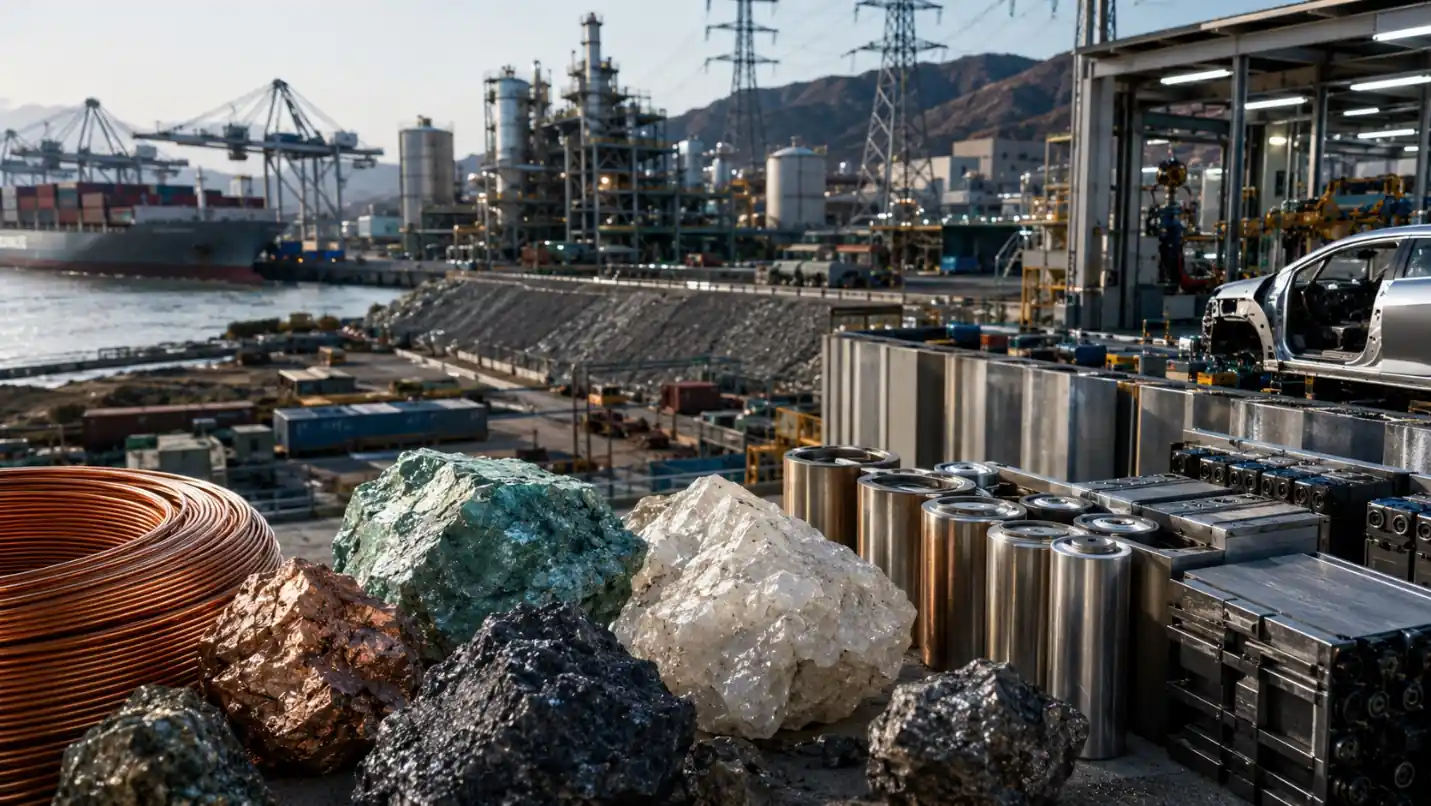
Energy systems are redefining the economic value of minerals. Expansion in electricity generation, grids, storage, transport and nuclear power has raised demand for critical minerals faster than demand for conventional base metals. Demand for minerals used in energy technologies has grown by nearly 10 per cent annually, while EV battery deployment reached 1.2 TWh in 2025 and could approach 3 TWh by 2030. Expansion in data centres has added further pressure on energy requirements and the demand for gallium. Supply, however, is concentrated in ways that confer geopolitical leverage. Governments and firms have responded through finance, offtake agreements, processing capacity and mineral assets. This analysis examines how these forces have changed demand for minerals, the geography and economics of production and processing, and the exposure among major economies. It distinguishes present market conditions from scenario-based projections and identifies the constraints, dependencies and choices most consequential for sovereign and corporate decision-making.
Critical Minerals in Energy and Industrial Policy
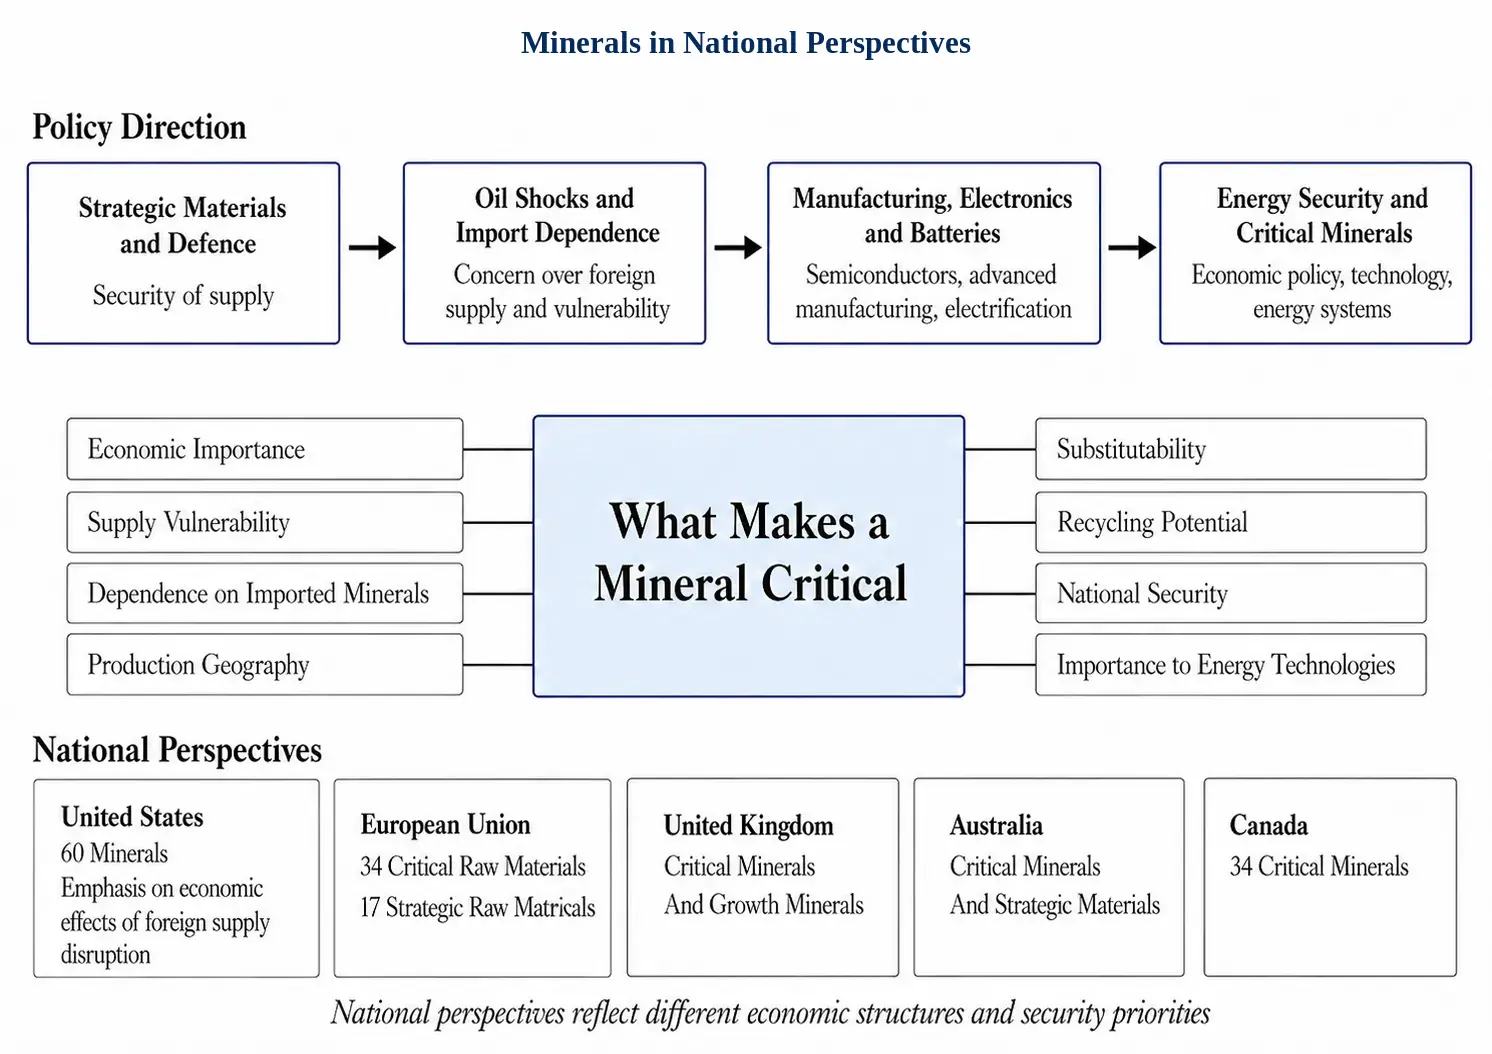
The contemporary idea of a critical mineral descends from strategic materials policy developed around defence and industrial applications. Its remit expanded as the oil shocks intensified concern over import dependence, while manufacturing, electrification, cleantech and semiconductors have made access to minerals increasingly important to economic policy. Governments now employ several categories, including critical minerals, critical raw materials, strategic minerals, strategic materials and energy transition minerals, each reflecting national economic structure and policy priorities.
Classification commonly combines economic importance with vulnerability to interruption, but countries apply these perspectives differently. The United States' 2025 list contains 60 minerals, including lithium, cobalt, natural graphite, copper, silver, uranium, gallium, germanium and fifteen rare earth elements. Its methodology incorporates estimated economic effects from disruptions in foreign supply. The European Union identifies 34 critical raw materials, of which 17 are strategic raw materials, including copper, cobalt, battery grade lithium, nickel, graphite, gallium, germanium and rare earths used for permanent magnets. The United Kingdom classifies lithium, cobalt, natural graphite, nickel and rare earth elements as critical, but places copper and uranium on its separate growth minerals list. Australia classifies lithium, cobalt, graphite and rare earth elements as critical, but places copper, aluminium, phosphorus, tin and zinc among strategic materials, because their supply does not currently meet Australia's vulnerability threshold. Canada, reflecting its resource endowment and industrial priorities, includes copper, potash, uranium, high purity iron ore, lithium, nickel and rare earth elements among its 34 critical minerals. The divergence cannot be decoupled from distinct national security and economic priorities.
Mineral Resources and Reserves
The United States Geological Survey (USGS) distinguishes resources, which describe identified or inferred mineral concentrations, from reserves, which are economically recoverable under prevailing technical and economic conditions. Production depends on ore grade, recovery rates, type of deposit, infrastructure, prices and investment. These conditions differ by mineral. Cobalt is frequently produced with copper or nickel, while gallium, germanium and tellurium are commonly recovered from the production of other metals. The International Energy Agency (IEA) identifies this dependence on by-product and co-product production as an important constraint on the responsiveness of supply.
Latin America and the Caribbean account for approximately 40 per cent of global copper mine production and about one-quarter of lithium supply, while production of cobalt remains concentrated in the Democratic Republic of Congo. The IEA’s 2026 project assessment indicates a 2035 copper shortfall of about 25 per cent against primary supply requirements under its Stated Policies Scenario, despite additional projects in the pipeline.
| Mineral | Global Reserves | Leading Reserve Holders | Latest Global Production | Leading Producing Countries | Industrial Application |
|---|---|---|---|---|---|
| Copper | 980 Mt | Chile 180 Mt; Australia 100 Mt; Peru 85 Mt | 23.0 Mt (2025e) | Chile 5.3 Mt; DR Congo 3.2 Mt; Peru 2.7 Mt | Electricity grids, power systems, electrical equipment, EVs |
| Lithium | 37.0 Mt Li | Chile 9.2 Mt; Australia 8.4 Mt; China 4.6 Mt | 290 kt Li (2025e) | Australia 92 kt; China 62 kt; Chile 56 kt | EV batteries, stationary energy storage |
| Cobalt | 12.0 Mt Co | DR Congo 6.0 Mt; Australia 1.7 Mt; Russia 0.8 Mt | 310 kt Co (2025e) | DR Congo 230 kt; Indonesia 44 kt; Russia 7.7 kt | Batteries, superalloys |
| Nickel | >140 Mt Ni | Indonesia 62 Mt; Australia 25 Mt; Brazil 16 Mt | 3.9 Mt Ni (2025e) | Indonesia 2.6 Mt; Philippines 270 kt; Russia 200 kt | Stainless steel, batteries |
| Natural graphite | 310 Mt | China 100 Mt; Brazil 74 Mt; Madagascar 27 Mt | 1.8 Mt (2025e) | China 1.4 Mt; Madagascar 80 kt; Tanzania 75 kt | Battery anodes, refractories |
| Rare earth elements | >85 Mt REO | China 44 Mt; Brazil 21 Mt; Australia 6.3 Mt | 390 kt REO (2025e) | China 270 kt; United States 51 kt; Australia 29 kt | Permanent magnets, EV motors, wind turbines, electronics |
| Uranium¹ | 5.93 MtU identified recoverable resources ≤US$130/kgU | Australia 1.67 MtU; Kazakhstan 0.814 MtU; Canada 0.582 MtU | 60.2 ktU (2024) | Kazakhstan 23.27 ktU; Canada 14.31 ktU; Namibia 7.33 ktU | Nuclear power |
| Gallium² | Not reported on a comparable reserve basis | — | ≈900 t primary gallium (2025e) | China ≈900 t; Russia ≈6 t; Japan ≈3 t | Semiconductors, power electronics, LEDs |
Source: United States Geological Survey, Mineral Commodity Summaries 2026, version 1.3, May 2026. USGS identifies the 2026 edition as its earliest comprehensive source of 2025 world mineral production data. Copper and nickel data are reported in the USGS country tables. Lithium, cobalt and rare earth data are from the corresponding 2026 USGS tables. Natural graphite, gallium and the limitations on comparable germanium reporting are reflected in the respective commodity tables.
¹ Uranium is not covered by the USGS Mineral Commodity Summaries as a nonfuel mineral. The figure shown is Reasonably Assured Resources plus Inferred Resources recoverable at up to US$130/kgU, rather than USGS-based mineral reserves; 2024 production is stated in tonnes of uranium.
² Gallium is predominantly recovered as a by-product, and USGS does not provide a conventional country reserve table comparable with copper, lithium or nickel. USGS estimates 2025 primary production at about 900 tonnes, majorly in China.
Processing and Refining
Processing, including beneficiation, smelting and refining, determines whether mineral extraction becomes an industrial input. These stages require distinct chemistry, equipment, process control and technical knowledge. In 2024, China accounted for 60 per cent of mined production of magnet rare earths, 91 per cent of refined output and 94 per cent of sintered permanent magnet production. Projects announced outside China indicate more than 50 kt of mining capacity by 2035, but less than 40 kt of refining and separation capacity and about 18 kt of capacity for metals, alloys and finished magnets. Battery materials display a comparable concentration after refining. In 2025, China produced about 85 per cent of cathode active material and more than 90 per cent of anode active material used in electric vehicle batteries. The IEA reports that battery plants commonly require more than five years after the launch of operations to approach nominal output, while competitive production generally requires yields above 90 per cent. Processing capacity therefore acquires economic significance only when it can deliver qualified material to the required specification and at the required cost and volume.
Inputs to Mineral Production
Mineral production is bounded by physical inputs as much as by ore bodies. Smelting, refining and chemical conversion consume electricity, fuels, water and chemical reagents at scales that can determine whether production is competitive. Transport corridors, ports, specialist equipment, maintenance capability and skilled labour add fixed and operating costs. The World Bank’s 2026 assessment of smelting and refining in developing countries treats energy costs, infrastructure, technology, skills, finance and access to markets as determinants of commercial feasibility, rather than assuming that mineral endowment confers an advantage in processing.
Sulphur illustrates the dependence of mineral production on inputs originating outside the mine. The Middle East produces about one-quarter of global sulphur, and approximately half of seaborne sulphur trade passes through the Strait of Hormuz. Disruption in 2026 raised sulphur and sulphuric acid prices. The IEA reported higher production costs for copper, lithium, cobalt, nickel and rare-earth processing, with acid becoming the largest cost component in some operations. A country may possess reserves yet face processing costs above those associated with exporting concentrate. Mineral policy that ignores these requirements risks converting geological advantage into high-cost capacity.
Recycling and Substitution
Recycling reduces requirements for newly produced minerals only when scrap is collected, processed and recovered to specification. Recycling cannot yet provide minerals on a scale proportionate to battery deployment. In 2026, production scrap remains the principal feedstock because most electric vehicle and stationary storage batteries installed during the expansion since 2020 remain in service. The IEA estimates that announced global recycling capacity in 2030 could be seven times available feedstock, while available feedstock could exceed announced capacity by 60 per cent in 2040. Under current policies, average recycling rates across key energy minerals could rise from about 10 per cent today to almost 20 per cent by 2040. Copper and cobalt already have established secondary supply, whereas lithium, nickel and rare earth magnet recycling expand from a lower base.
Increased use of lithium iron phosphate batteries reduces requirements for nickel and cobalt compared with lithium-ion batteries using cathodes with higher proportions of nickel, such as nickel-manganese-cobalt and nickel-cobalt-aluminium batteries. An IEA sensitivity case found that faster adoption of lithium iron phosphate and sodium-ion technologies could reduce requirements for minerals in electric vehicle batteries by about 13 per cent in 2030 and 18 per cent in 2050.
Prices, Investment and Project Development
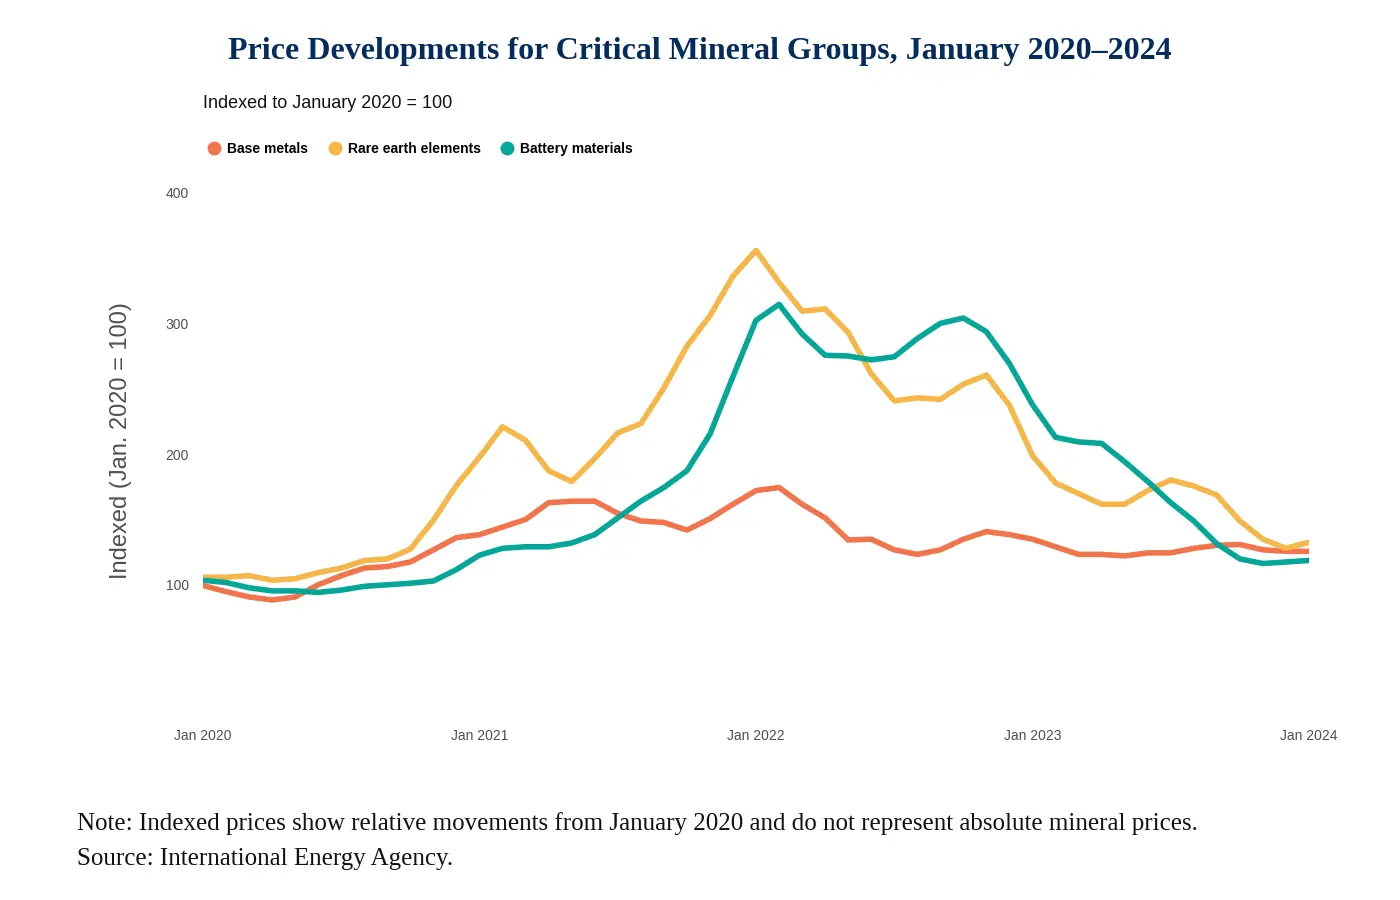
Prices govern the threshold at which mineral resources attract exploration and development. Prices of lithium increased eightfold during 2021–2022 and fell by more than 80 per cent from 2023. By 2025, investment by lithium-focused companies had declined by about 40 per cent. Across critical minerals, investment fell by 9 per cent in 2025 and exploration expenditure fell by more than 10 per cent, while spending by copper-focused companies increased by 8 per cent. Low prices reduce costs for users of batteries and other energy technologies, but sustained price weakness can suppress the investment required for future production. The IEA estimated in 2025 that mining projects required about USD 500 billion of new investment to 2040 under its Stated Policies Scenario, rising to about USD 600 billion under the Announced Pledges Scenario.
IEA analysis of mines commissioned between 2010 and 2019 found an average period of more than 16 years, from discovery to initial production, including more than 12 years for exploration and feasibility studies and four to five years for construction. Announced projects therefore represent prospective capacity rather than assurances of supply. The IEA’s 2026 assessment still indicates deficits for copper and lithium in 2035 under its Stated Policies Scenario despite projects already identified in the pipeline. Project pipelines require assessment by development stage, financing status and probability of commercial production.
Concentration of Supply and Risk of Disruption
Concentration becomes significant when an interruption at a dominant source cannot be offset by inventory, alternative suppliers or substitution before industrial production is impaired. Dependence must therefore be measured at the production stage required by the user. Additional mining capacity offers limited protection where separation, refining or intermediate production remains concentrated. Corporate concentration and vertical integration can reinforce this position when one producer controls successive stages, while qualification requirements restrict rapid substitution between suppliers.
In 2025, Chinese export controls covering seven rare earth elements reduced utilisation rates and temporarily halted production at some automobile plants. Ford suspended production of the Explorer at its Chicago Assembly Plant for about a week, while Suzuki halted production of the Swift at its Sagara Plant in Japan for a period. Several unnamed European automotive parts facilities also suspended production as a second-order effect. The IEA has estimated that full application of the controls could threaten approximately USD 6.5 trillion of annual production across automotive, defence and energy industries outside China. A complete interruption of trade in battery-grade graphite could similarly disrupt more than USD 300 billion of annual electric vehicle battery and battery storage production. These estimates measure the value of industrial activity dependent on concentrated processing capacity, not the commercial value of the minerals concerned.
China’s Position in Critical Mineral Supply Chains
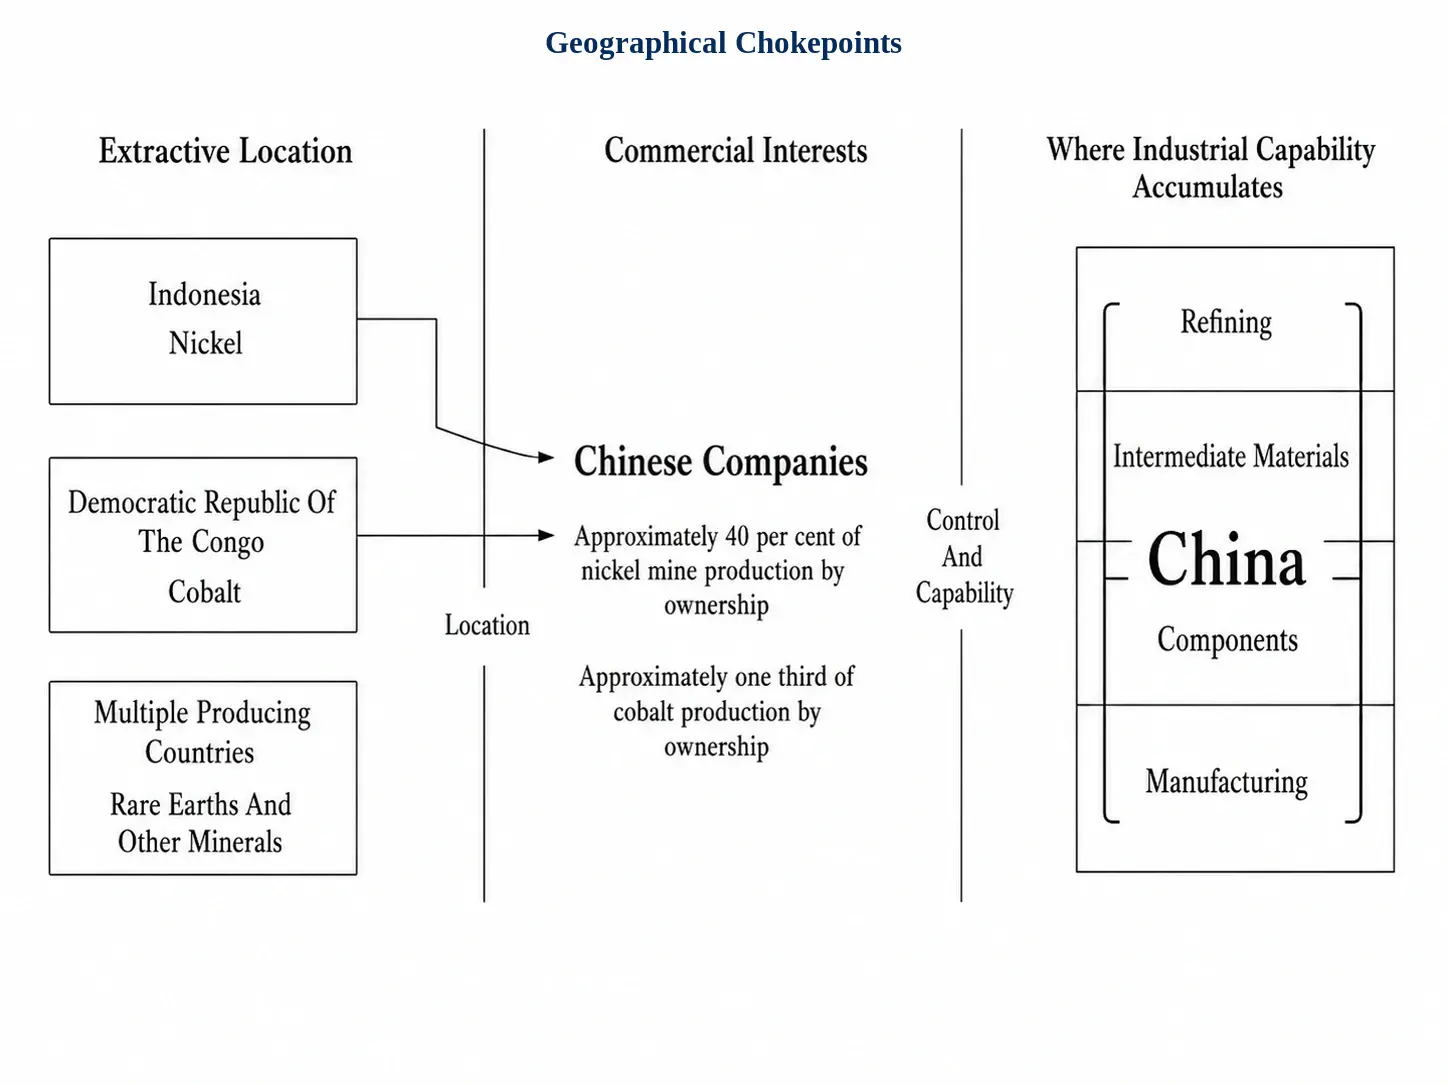
China’s present position has been accumulated through two decades of expansion beyond mining. In rare earths, its share of sintered permanent magnet production rose from about 50 per cent in 2005 to 94 per cent in 2024, while its shares of mined magnet rare earths and refined output were 60 per cent and 91 per cent respectively. Copper followed a comparable trajectory. Since 2005, China has accounted for more than 90 per cent of growth in global copper smelting capacity, increasing its share from about 15 per cent to 50 per cent by 2025.
The sources of feedstock extend beyond Chinese deposits. Chinese companies accounted for approximately 40 per cent of nickel mine production by ownership in 2023 and about one-third of cobalt production, despite Indonesia and the Democratic Republic of the Congo being the major locations of extraction. Domestic mining, imported ores and concentrates, and overseas equity interests consequently support processing capacity on a scale not explained by Chinese geology.
In 2025, China produced about 85 per cent of cathode active material, more than 90 per cent of anode active material and over 80 per cent of battery cells. Its large domestic electric vehicle market provides demand at scale, while supplier networks and high plant utilisation reinforce cost competitiveness. China’s position resides in accumulation across stages. Replicating one stage outside China does not reproduce the industrial system assembled across the full sequence.
State Intervention
Producer countries use export taxes, licensing, prohibitions and requirements for domestic processing to retain more value from extraction. OECD data show that export restrictions increased fivefold between 2009 and 2024. About 16 per cent of global trade faced at least one restriction during 2022–2024, including 67 per cent of cobalt and 66 per cent of manganese exports. Indonesia’s prohibition on exports of nickel ore and domestic processing requirement aimed to deepen stainless-steel production, but a WTO panel found both measures inconsistent with Article XI:1 of GATT 1994.
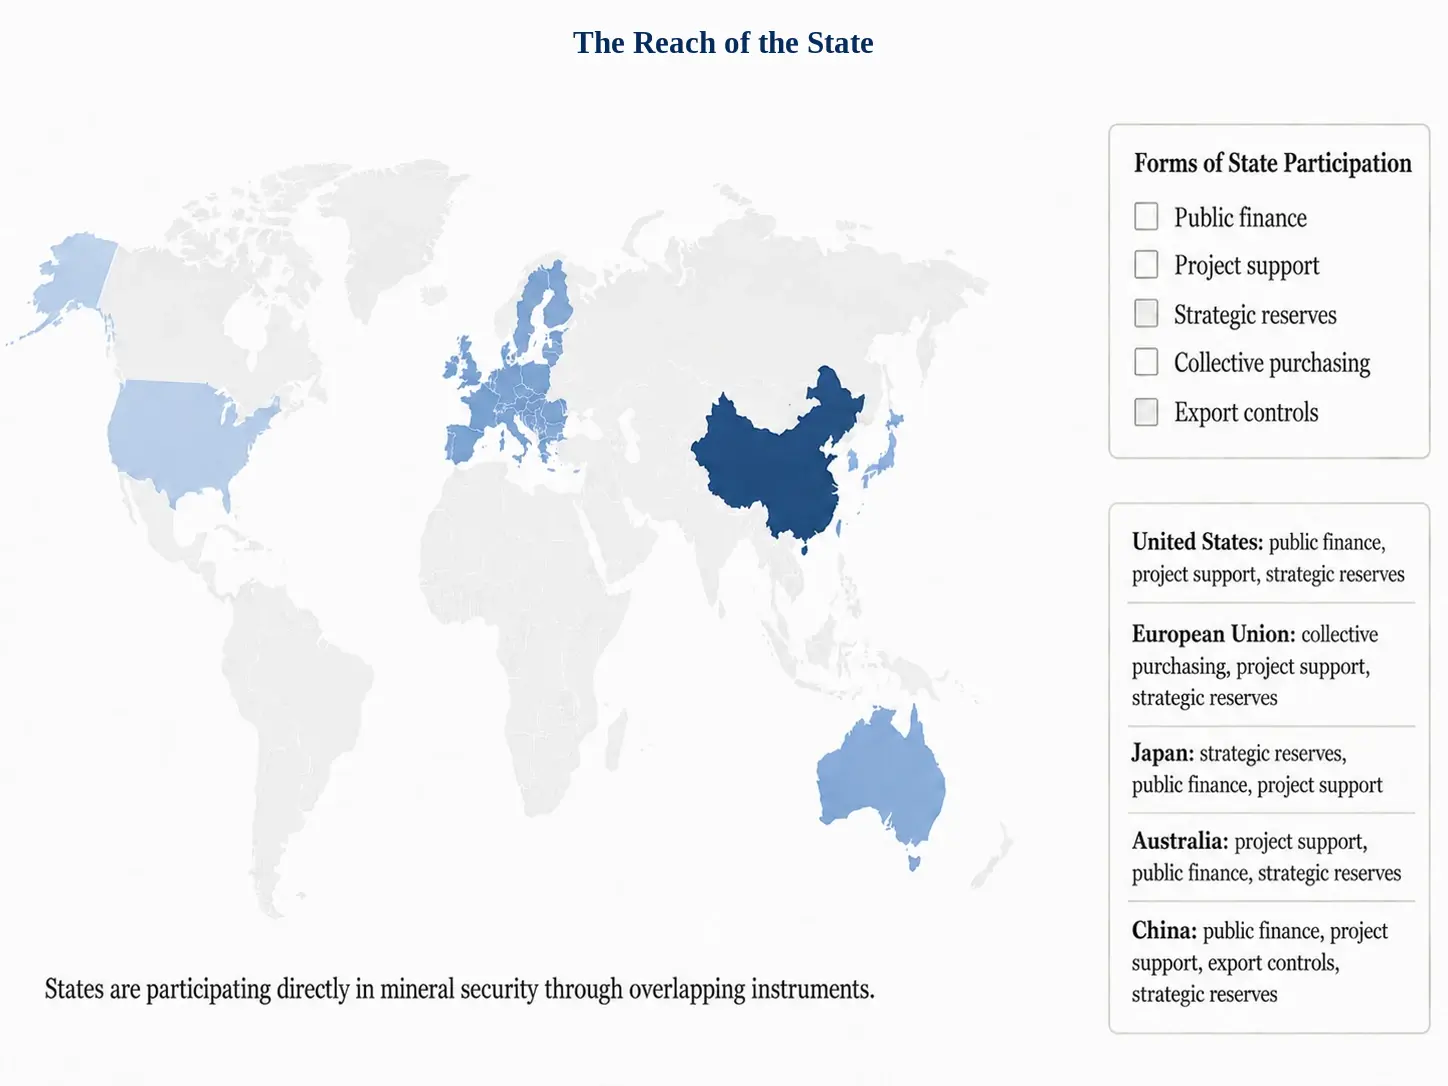
Importer governments have increasingly used grants, concessional finance, state investment, purchase commitments, strategic stockpiling and trade measures. In 2026, the US Department of Energy offered approximately US$500 million for processing of critical minerals, battery manufacturing and recycling, with another programme offering about US$69 million for production and refining technologies. A 2025 US Department of Defense agreement included a US$150 million loan for rare earth separation at Mountain Pass. The European Union’s Critical Raw Materials Act designates selected strategic projects, while its Raw Materials Mechanism supports demand aggregation, joint purchasing and storage. China introduced export controls in April 2025 covering samarium, terbium, dysprosium, yttrium and other specified rare earth products, including permanent magnet materials, and imposed licensing requirements on certain materials. Japan had, by May 2026, approved public support for domestic or overseas projects involving nickel, cobalt, tungsten, rare earth elements, uranium and the recovery of lithium from used batteries. Australia’s Critical Minerals Strategic Reserve, established in 2026 with AUD1 billion available for transactions and additional funding for selective stockpiling, initially covers antimony, gallium and rare earth elements, minerals required across energy, high-technology manufacturing and national security uses.
Energy System and Demand for Minerals
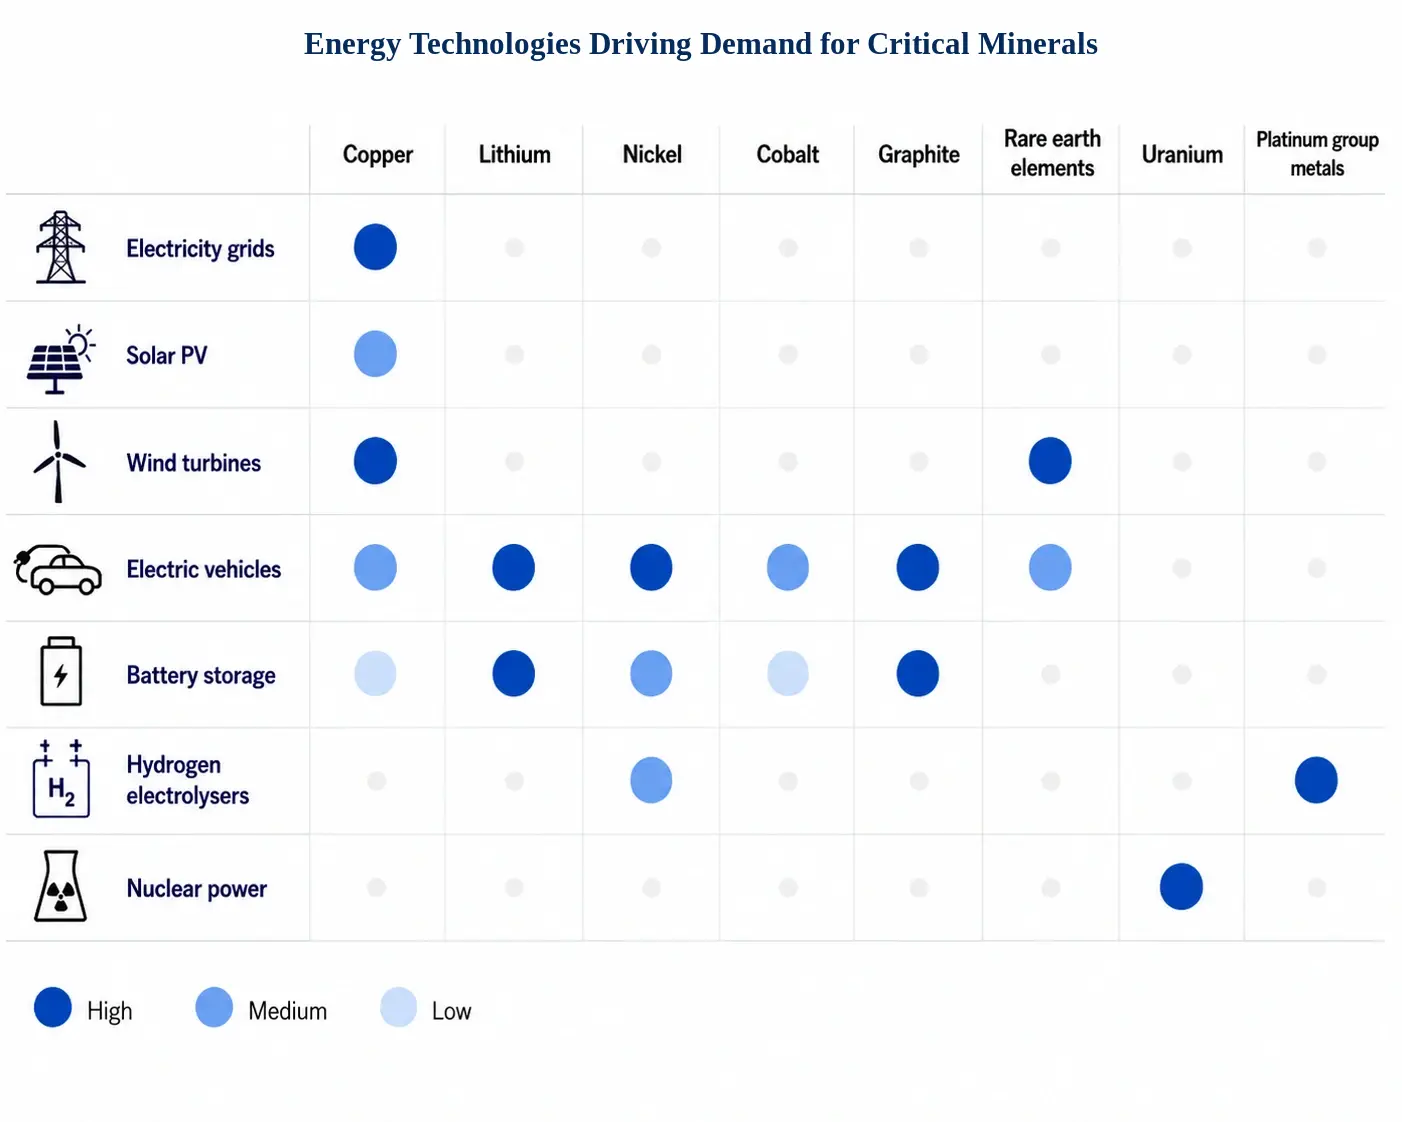
The scale of energy investment has changed the composition of demand for minerals. Electricity generation, transmission and distribution, storage, electric transport, nuclear power, hydrogen production and digital infrastructure require different combinations of copper, aluminium, lithium, graphite, nickel, cobalt, rare earth elements, uranium and platinum group metals. The IEA estimates that demand for key energy minerals has increased at close to 10 per cent a year in recent years, compared with about 1 per cent for base metals.
In 2020, the IEA’s Stated Policies Scenario projected that annual deployment of electric vehicle batteries would rise from about 170 GWh to 1.5 TWh by 2030, while its Sustainable Development Scenario projected 3 TWh. By 2025, actual deployment of electric vehicle batteries had reached 1.2 TWh, more than seven times the 2020 level and already 80 per cent of the 2020 projection for 2030. The IEA’s 2026 assessment now places deployment at almost 3 TWh by 2030 under both Current Policies and Stated Policies, and almost 5 TWh by 2035 under Stated Policies. That implies compound annual growth of about 20 per cent during 2025–2030 and 15 per cent during 2025–2035.
Lithium iron phosphate batteries accounted for more than 55 per cent of electric vehicle battery deployment in 2025, moderating expected growth in demand for nickel and cobalt while sustaining demand for lithium and graphite. Expansion in electricity transmission has increased requirements for copper and aluminium; permanent magnet motors and some wind turbines require neodymium and praseodymium; nuclear power requires uranium together with conversion, enrichment and fuel fabrication. Electrolyser technologies differ in their requirements for nickel, iridium and platinum.
The IEA’s 2021 Sustainable Development Scenario projected that requirements from clean energy technologies would quadruple by 2040, with lithium rising more than fortyfold and graphite, cobalt and nickel around twenty- to twenty-fivefold. The 2026 Stated Policies Scenario, using different assumptions and total demand, projects aggregate demand for critical minerals almost doubling between 2025 and 2040, equivalent to approximately 4.7 per cent annually. Demand for lithium is projected to rise more than threefold, implying more than 7.6 per cent annually, while nickel, graphite and rare earths are projected to increase by 50–90 per cent, approximately 2.7–4.4 per cent annually.
Demand from Energy vs. Digital Technologies, Defence and Manufacturing
Energy systems, AI infrastructure, semiconductors, telecommunications, aerospace, defence and manufacturing draw upon an overlapping mineral base, but do not have comparable requirements or specifications. Electricity networks, electric transport and energy storage account for much of the projected increase in demand for copper, lithium, graphite and magnet rare earth elements. Digital technologies require copper and aluminium through data centres and electricity infrastructure. Global electricity consumption by data centres is projected by the IEA to rise at about 15 per cent annually between 2024 and 2030, reaching approximately 945 TWh in 2030. Gallium required for data centres in 2030 could exceed 10 per cent of present global supply, while China accounts for approximately 95 per cent of gallium refining. Semiconductors and telecommunications require smaller quantities of gallium, germanium, indium, silicon, tantalum, tungsten, tin, silver and rare earth elements. Aerospace and defence production requires cobalt, titanium, tungsten, yttrium and rare earth elements where thermal resistance, strength, magnetic performance or properties limit substitution.
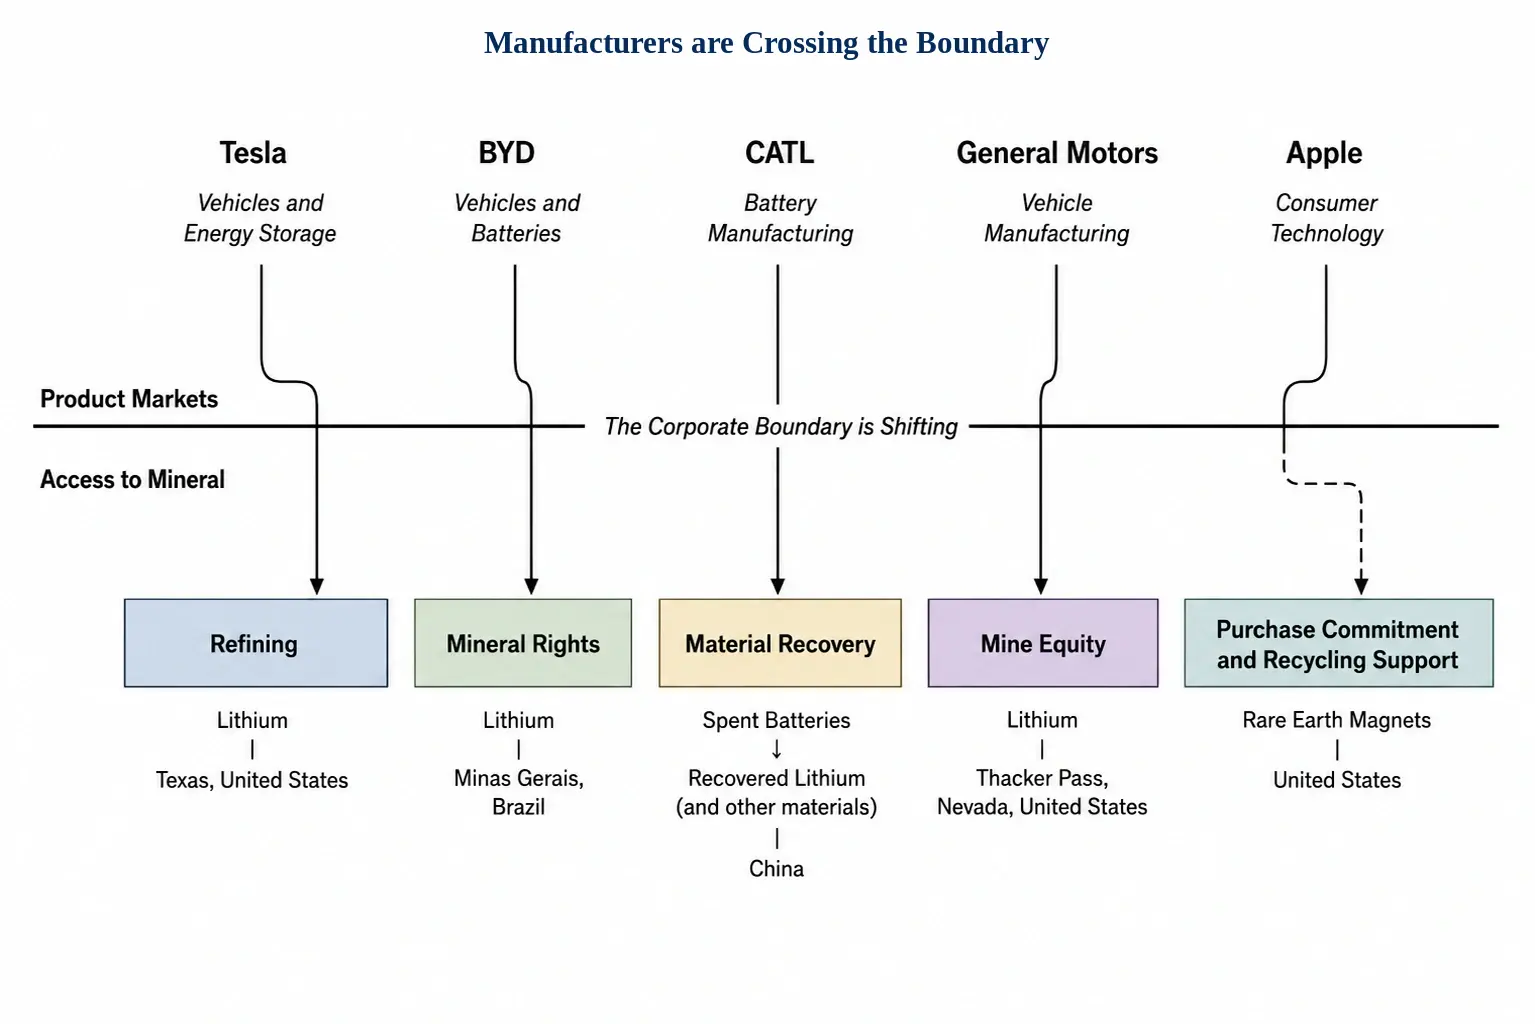
Corporate strategies have extended beyond purchasing finished components. Tesla identifies aluminium, steel, lithium, nickel and copper among its principal raw materials and began operating its Texas lithium refinery in January 2026, adding direct processing to long-term procurement and qualification of multiple suppliers. BYD acquired mineral rights over two lithium-bearing areas in Minas Gerais, Brazil, in 2023 through a Brazilian subsidiary, placing a battery and vehicle manufacturer at the resource stage. The limits of such integration were visible in Chile, where BYD abandoned a proposed lithium cathode plant in 2025 after changes in market conditions.
CATL’s manufacturing scale makes it one of the largest purchasers of battery materials. Its lithium-ion battery sales reached 661 GWh in 2025, 39 per cent above 2024, requiring correspondingly large volumes of lithium, graphite, nickel and cobalt. In 2025, it processed 210,000 tonnes of spent batteries and recovered 24,000 tonnes of lithium salts. Recycling therefore forms part of CATL’s resource security strategy, reducing part of its requirement for newly produced minerals while providing recovered material for battery production.
General Motors has taken equity positions as well as purchase commitments. By the end of 2025, it held 38 per cent of the Thacker Pass lithium project in Nevada through its venture with Lithium Americas, alongside earlier agreements covering graphite, nickel, cobalt, cathode materials and rare earth magnets. Apple, representing digital hardware, committed US$500 million in 2025 to purchase rare earth magnets from MP Materials and support additional magnet production and recycling in the United States. In 2026, Apple reported that all batteries designed by the company used recycled cobalt and all magnets used recycled rare earth elements.
Competition among sectors is consequently determined by more than aggregate demand for minerals. Copper requirements from electricity systems can be enormous in physical volume, while additional demand for gallium, germanium, tungsten or particular rare earth elements can become economically significant at much smaller tonnages. Purity, chemical form, magnetic properties, customer qualification, inventory, recycling and access to processing determine required by one user can readily substitute for material required by another.
Critical Minerals Outlook to 2040
The IEA’s 2026 Current Policies, Stated Policies and High Demand scenarios do not support a uniform thesis. Through 2030, supply depends principally on whether projects under development reach commercial production, while demand continues to rise across energy technologies. Under the IEA base case, expected copper production remains about 25 per cent below primary supply requirements in the Stated Policies Scenario. Lithium also remains in deficit, while cobalt is projected to show a gap exceeding 25 per cent following the Democratic Republic of the Congo’s export quota. Nickel and graphite show smaller deficits. Earlier-stage projects could eliminate them if completed on schedule. By 2040, the IEA’s Stated Policies Scenario places total demand for critical minerals at almost twice the 2025 level. Lithium is projected to rise more than threefold; demand for nickel, graphite and rare earths is projected to increase by approximately 50–90 per cent. Recycling moderates requirements for newly produced minerals, with average recycling rates across key energy minerals projected to increase from about 10 per cent today to nearly 20 per cent by 2040.
Copper retains the most persistent constraint. Lithium remains sensitive to investment and battery deployment. Cobalt is unusually vulnerable to producer policy. Nickel requirements depend more on battery technology. Graphite and rare earths remain constrained principally by the concentration of processing location. Adequate mine production does not guarantee adequate industrial supply when refining, separation and production of intermediate materials remain concentrated, when alternative suppliers have not completed technical qualification, or when governments restrict exports.
Implications for Firms and Policymakers
Energy systems have increased the strategic importance of minerals by raising demand. The availability of ore is only one condition of supply. Production depends on project development, infrastructure and technical capability. Processing has added further constraints through scale, qualification and geographic concentration. Prices and government intervention have influenced investment, trade and access, while China’s position rests on accumulated capacity across multiple stages. Recycling and substitution can reduce requirements for newly produced minerals, but neither has eliminated the need for sustained investment across mining, processing and manufacturing. The outlook differs by mineral, technology and production stage and cannot be reduced to a single narrative.
For firms, security of supply requires assessment beyond mine production and headline reserves. Long-term purchase commitments, investment in processing, interests in mineral projects, recycling and qualification of alternative suppliers have become part of resource security. For policymakers, geological endowment does not guarantee industrial advantage. Policies designed to expand domestic production must account for infrastructure, technical capability and the requirements of processing and manufacturing. Import-dependent economies face different demands in reducing vulnerability. The implications also differ by mineral. Firms and governments therefore require mineral-specific strategies rather than a single critical minerals policy.
The next contest over critical minerals will not be decided by whoever possesses the largest deposits, but by whoever can convert geological endowments into a source of strength before demand, supply and policy change the terms of access.
Disclaimer
The scope of this analysis may differ according to its intended use. Unless otherwise agreed in relation to a specific mandate, it was not prepared by reference to the circumstances or requirements of any particular audience. Nothing in it constitutes investment advice or a determination of its suitability or appropriateness for a particular recipient. The material reflects the evidence and conditions relevant to the period examined and may be affected by subsequent developments. Users are responsible for determining the relevance of its content to their circumstances and for obtaining appropriate advice where a decision requires specialist judgement.
About the Chief Analyst

Nsikan Nyauko is an economist and Chartered Management Consultant with decades of cross-industry experience and a range of postgraduate qualifications spanning Economics, Big Data and Analytics, International Affairs and Diplomacy, International Commercial Law, Digital Transformation, Project Management, Business and Management, and Public Health. He serves the Centre as Faculty, Executive Development and Lead Advisor, Group Regional Programme for EMEA, APAC and the Americas. He has built relationships across industry, government, international organisations, academia, think tanks and civil society and has developed policy and strategy papers to support decision-making by corporations and sovereign entities.
Associate Analysts Nadine Karam; Marek Zieliński; Yun-seo Han; Camila Arriagada; Elias Nordström; Graham Bellamy